Image:WMAP 2008 94GHz foregrounds.png
From Wikipedia, the free encyclopedia
Size of this preview: 800 × 400 pixels
Full resolution (2,048 × 1,024 pixels, file size: 1.58 MB, MIME type: image/png)
| | This is a file from the Wikimedia Commons. The description on its description page there is shown below.
|
[edit] Summary
| Description |
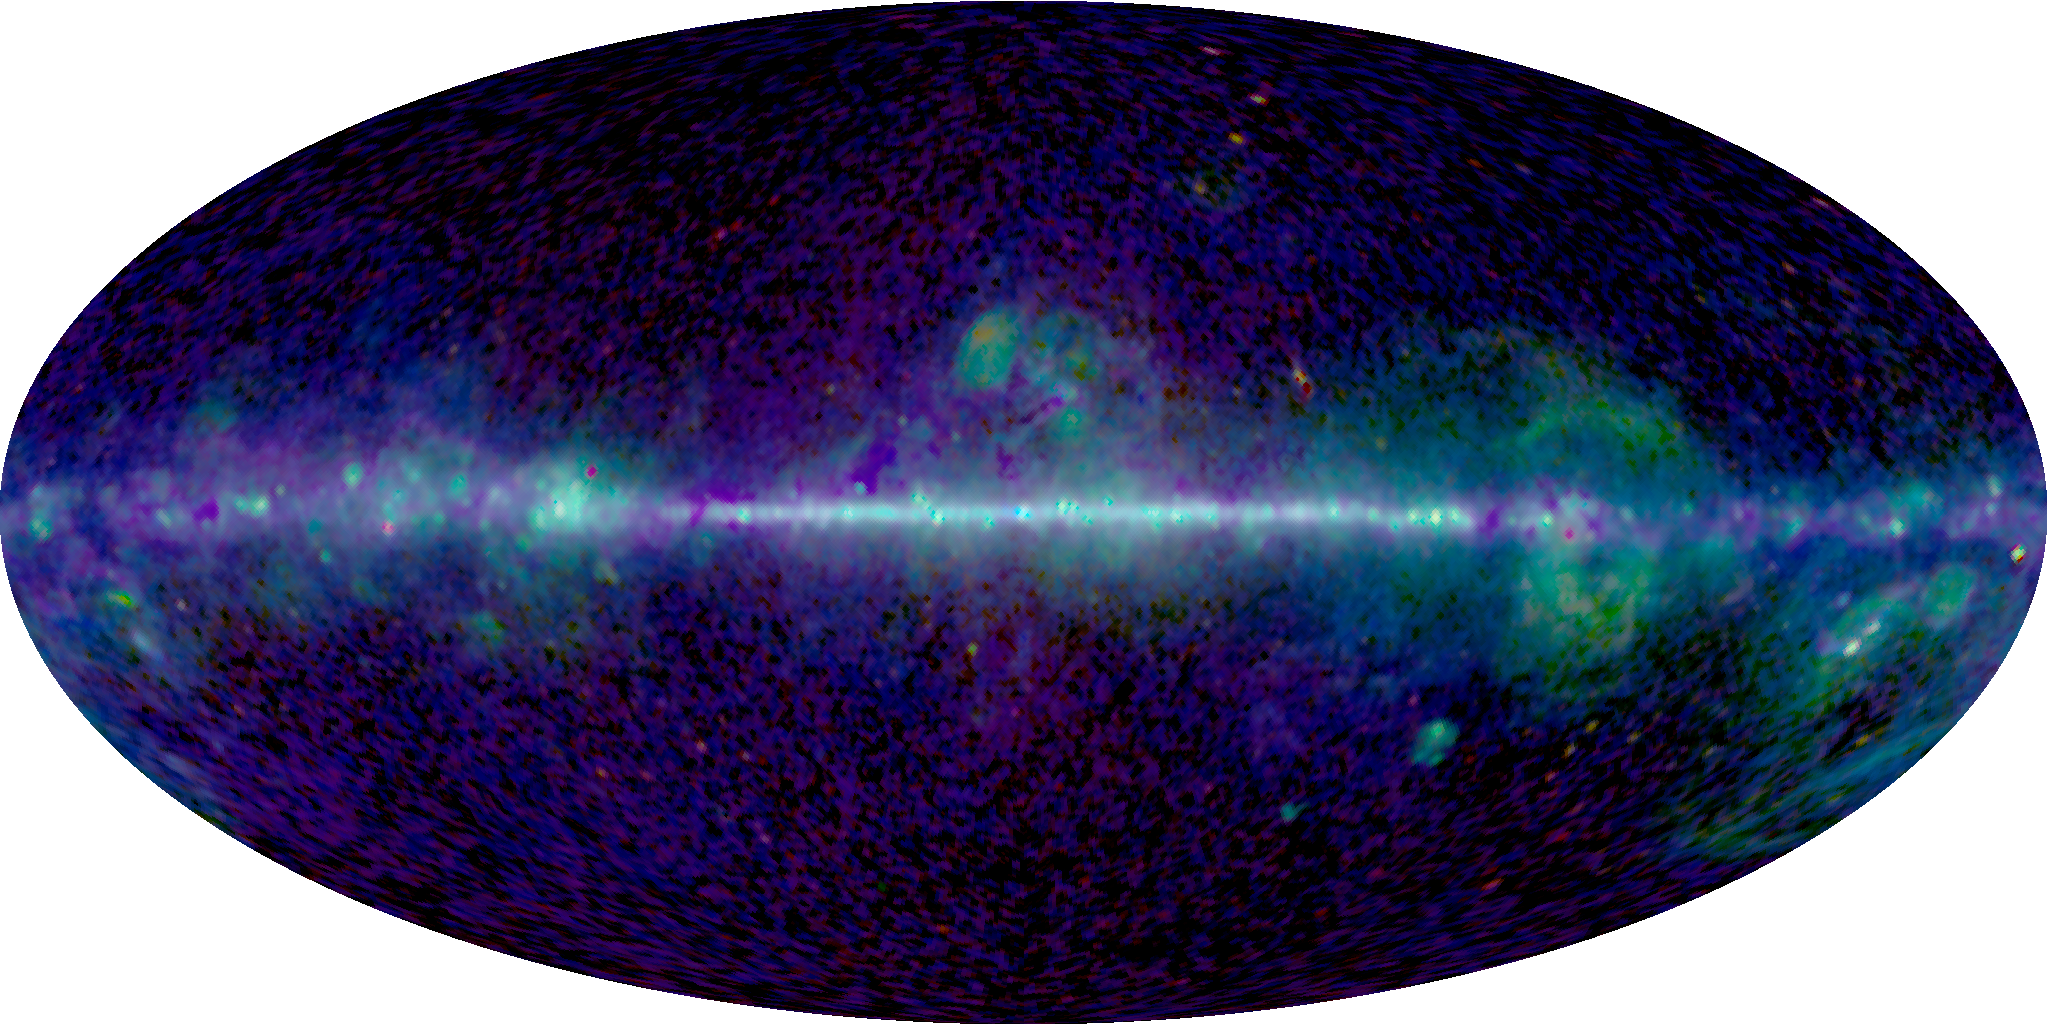
English: "Three-color maps from the Maximum Entropy Method (MEM) model for the 5 WMAP frequency bands. These maps indicate which emission mechanism dominates as a function of frequency and sky position. Synchrotron is red, free-free is green, and thermal dust is blue." W-Band Map (94 GHz), logarithmic scale.
|
|---|---|
| Source | |
| Date |
March 2008 |
| Author |
NASA / WMAP Science Team |
| Permission (Reusing this image) |
see below |
[edit] Licensing
|
|
This file is in the public domain because it was created by NASA. NASA copyright policy states that "NASA material is not protected by copyright unless noted". (NASA copyright policy page or JPL Image Use Policy).
Deutsch | English | Español | Français | Nederlands | Português | Русский | 中文(简体) | 中文(繁體) | +/- |
|
 |
Warnings:
|
File history
Click on a date/time to view the file as it appeared at that time.
| Date/Time | Dimensions | User | Comment | |
|---|---|---|---|---|
| current | 14:56, 26 April 2008 | 2,048×1,024 (1.58 MB) | Mike Peel | (== Summary == {{Information |Description={{en|"Three-color maps from the Maximum Entropy Method (MEM) model for the 5 WMAP frequency bands. These maps indicate which emission mechanism dominates as a function of frequency and sky position. Synchrotron is ) |
File links
The following pages on the English Wikipedia link to this file (pages on other projects are not listed):


![[1]](http://lambda.gsfc.nasa.gov/product/map/current/map_images/mem_3color_5yr_W_2048.png)