Image:White noise spectrum.png
From Wikipedia, the free encyclopedia
No higher resolution available.
White_noise_spectrum.png (800 × 600 pixels, file size: 5 KB, MIME type: image/png)
| | This is a file from the Wikimedia Commons. The description on its description page there is shown below.
|
[edit] Summary
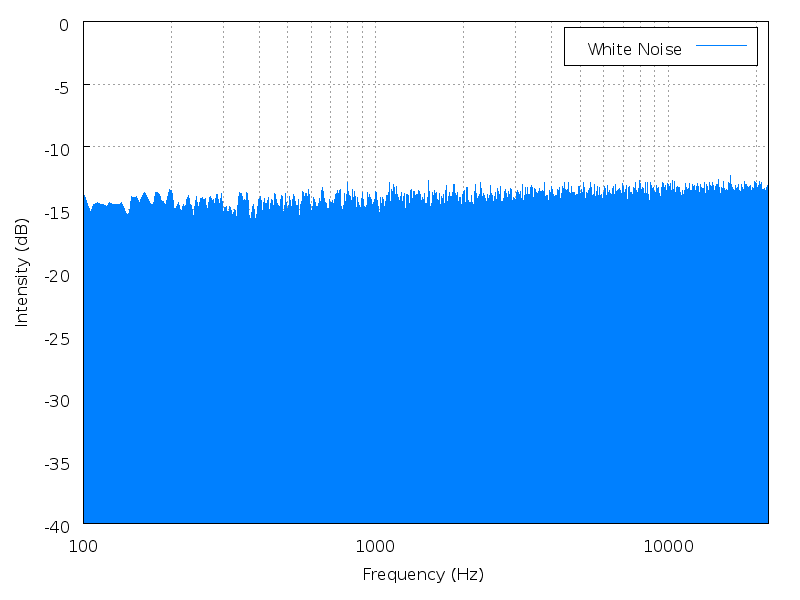
Spectrum analysis of uncompressed source for 10 seconds of white noise file— play in browser. Note the logarithmic frequency scale.
The analysis was done using Audacity, and plotting with gnuplot. Transparency was touched up in GIMP to make the graph background pure white.
(I find the log frequency plot here confusing, as it suggests that white noise may rise slightly with increasing frequency. A linear frequency scale would be better. However, for comaprison with pink noise, having the log frequency plot keeps the frequency axis on both the same.)
[edit] Instructions
Obtain the frequency analysis from Audacity, set the maximum number of windows, and use a Hamming window. The following script was used to generate the image:
set terminal png transparent font "/usr/share/fonts/truetype/ttf-bitstream-vera/Vera.ttf" size 800,600 enhanced
set output "white_noise_spectrum.png"

# this seems to fix the trailers on the TTF font for the x-label
set bmargin 4

# enable grid
set grid
set grid mxtics

# set up x-axis
set logscale x 10
set xrange [100:22000]
set xlabel "Frequency (Hz)"
set xtics border nomirror

# set up y-axis
set yrange [-40:0]
set ylabel "Intensity (dB)"
set ytics border nomirror

# again to deal with bad bboxes on the TTF...
set key height 1 box

# plot the output from Audacity
plot "white_noise.txt" title "White Noise" with filledcurves x1 3
[edit] Licensing
| I, the copyright holder of this work, hereby release it into the public domain. This applies worldwide. In case this is not legally possible: Afrikaans | Alemannisch | Aragonés | العربية | Asturianu | Български | Català | Česky | Cymraeg | Dansk | Deutsch | Eʋegbe | Ελληνικά | English | Español | Esperanto | Euskara | Estremeñu | فارسی | Français | Galego | 한국어 | हिन्दी | Hrvatski | Ido | Bahasa Indonesia | Íslenska | Italiano | עברית | Kurdî / كوردی | Latina | Lietuvių | Latviešu | Magyar | Македонски | Bahasa Melayu | Nederlands | Norsk (bokmål) | Norsk (nynorsk) | 日本語 | Polski | Português | Ripoarisch | Română | Русский | Shqip | Slovenčina | Slovenščina | Српски / Srpski | Svenska | ไทย | Tagalog | Türkçe | Українська | Tiếng Việt | Walon | 中文(简体) | 中文(繁體) | zh-yue-hant | +/- |
File history
Click on a date/time to view the file as it appeared at that time.
| Date/Time | Dimensions | User | Comment | |
|---|---|---|---|---|
| current | 12:54, 26 November 2006 | 800×600 (5 KB) | Javg | (== Summary == Spectrum analysis of uncompressed source for {{Audio|White noise.ogg|10 seconds of white noise}}. Note the logarithmic frequency scale. The analysis was done using Audacity, and plotting with gnuplot. Transparency was touched up in ) |

