Image:Waves on an oscillascope.png
From Wikipedia, the free encyclopedia
No higher resolution available.
Waves_on_an_oscillascope.png (585 × 166 pixels, file size: 5 KB, MIME type: image/png)
| | This is a file from the Wikimedia Commons. The description on its description page there is shown below.
|
 |
This image should be recreated using vector graphics as an SVG file. This has several advantages; see Commons:Media for cleanup for more information. If an SVG form of this image is already available, please upload it. After uploading an SVG, replace this template with template {{Vector version available|new image name.svg}} in this image. |
|
العربية | Български | Català | Česky | Dansk | Deutsch | English | Esperanto | Español | Français | 한국어 | Italiano | Magyar | Lietuvių | Nederlands | 日本語 | Polski | Português | Română | Русский | Suomi | Svenska | Türkçe | Українська | Tiếng Việt | मराठी | 中文(繁體) | 中文(简体) | +/- |
|
[edit] Summary
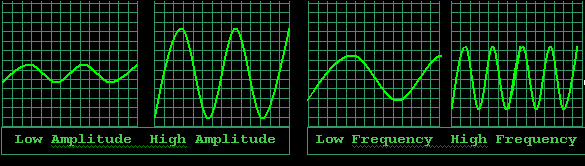
Comparison of high/low frequency and high/low amplitude waves. Drawn by Theresa knott
This diagram was created with the drawing tools that come with w:Microsoft Word. See w:Wikipedia:How to draw a diagram with Microsoft Word for advice on how to draw diagrams like this.
[edit] Licensing

| This file is licensed under Creative Commons Attribution ShareAlike 1.0 License |
| This file is licensed under Creative Commons Attribution ShareAlike 2.0 License (cc-by-sa-2.0). In short: you are free to share and make derivative works of the file under the conditions that you appropriately attribute it, and that you distribute it under this or a similar cc-by-sa license. |
File history
Click on a date/time to view the file as it appeared at that time.
| Date/Time | Dimensions | User | Comment | |
|---|---|---|---|---|
| current | 10:54, 8 October 2005 | 585×166 (5 KB) | Egil | ('''Comparison of high/low frequency and high/low amplitude waves. Drawn by Theresa knott''' This diagram was created with the drawing tools that come with Microsoft Word. See [[Wikipedia:How to draw a diagram with Microsoft Wo) |
File links
The following pages on the English Wikipedia link to this file (pages on other projects are not listed):

