Image:Svalbard temperature.png
From Wikipedia, the free encyclopedia
Size of this preview: 800 × 478 pixels
Full resolution (983 × 587 pixels, file size: 39 KB, MIME type: image/png)
| | This is a file from the Wikimedia Commons. The description on its description page there is shown below.
|
[edit] Summary
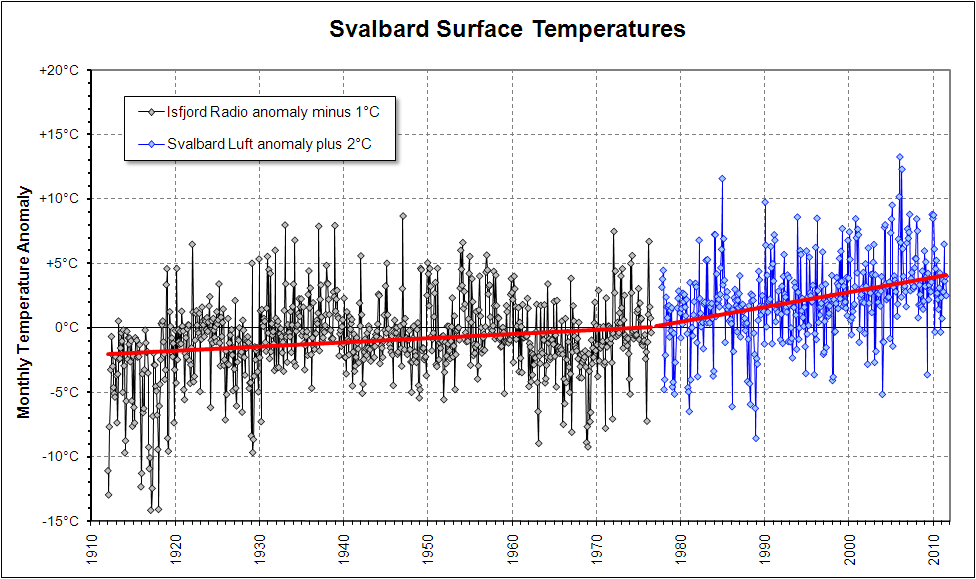
Svalbard surface temperature mean monthly anomalies 1912 to 2008, in °C. Anomalies are station monthly temperatures minus the local average for the month.
The recording station moved some 47 km from Isfjord Radio (78.1°N, 13.6° E) to Svalbard Luft (78.2°N, 15.5°E) in 1976, with little record overlap. There is an obvious station temperature difference, here largely removed by plotting anomalies from monthly averages instead of the raw temperatures.
A common base period for computing anomalies is not available because of the lack of record overlap. The base intervals used here are 1912-1976 for Radio and 1978-2007 for Luft (both near to the local full record). Because of the differing base intervals, the long-term uptrend results in a substantial step change in anomaly (circa 3°C) at the station change. To produce an indicative combined anomaly plot, the difference is here crudely adjusted by moving Isfjord down by 1°C and Luft up by 2°C, so that the trend lines meet at the station change. The resulting zero crossing is near 1975, so the plotted anomalies relate approximately to the commonly adopted 1960-90 interval.
The Svalbard record shows one of the strongest long-record warming trends on earth, in close agreement with the pattern of climate model predictions.
[edit] Source
Data from NASA GISS Surface Temperature Analysis.
[edit] Licensing
|
File history
Click on a date/time to view the file as it appeared at that time.
| Date/Time | Dimensions | User | Comment | |
|---|---|---|---|---|
| current | 01:24, 6 June 2008 | 983×587 (39 KB) | Glen Fergus | ({{Information |Description= |Source= |Date= |Author= |Permission= |other_versions= }} ) |
| 06:20, 12 December 2007 | 983×587 (41 KB) | Glen Fergus | ||
| 05:27, 8 June 2007 | 983×587 (41 KB) | Glen Fergus | ||
| 10:08, 3 October 2006 | 973×596 (39 KB) | Glen Fergus | ||
| 10:05, 3 October 2006 | 973×596 (39 KB) | Glen Fergus | ||
| 12:46, 28 September 2006 | 973×596 (39 KB) | Glen Fergus | ||
| 12:22, 28 September 2006 | 973×596 (39 KB) | Glen Fergus | (== Summary == Svalbard surface temperature record from the [http://data.giss.nasa.gov/gistemp/station_data/ NASA GISS Surface Temperature Analysis dataset]]. Graph of surface temperature anomalies 1911-2006, in degrees Celsius. Anomalies shown are month) |

