Image:Surface normal illustration.png
From Wikipedia, the free encyclopedia
Size of this preview: 556 × 600 pixels
Full resolution (1,379 × 1,488 pixels, file size: 24 KB, MIME type: image/png)
| | This is a file from the Wikimedia Commons. The description on its description page there is shown below.
|
| Description | |
|---|---|
| Source |
self-made |
| Date | |
| Author | |
| Permission (Reusing this image) |
see below |
| I, the copyright holder of this work, hereby release it into the public domain. This applies worldwide. In case this is not legally possible: Afrikaans | Alemannisch | Aragonés | العربية | Asturianu | Български | Català | Česky | Cymraeg | Dansk | Deutsch | Eʋegbe | Ελληνικά | English | Español | Esperanto | Euskara | Estremeñu | فارسی | Français | Galego | 한국어 | हिन्दी | Hrvatski | Ido | Bahasa Indonesia | Íslenska | Italiano | עברית | Kurdî / كوردی | Latina | Lietuvių | Latviešu | Magyar | Македонски | Bahasa Melayu | Nederlands | Norsk (bokmål) | Norsk (nynorsk) | 日本語 | Polski | Português | Ripoarisch | Română | Русский | Shqip | Slovenčina | Slovenščina | Српски / Srpski | Svenska | ไทย | Tagalog | Türkçe | Українська | Tiếng Việt | Walon | 中文(简体) | 中文(繁體) | zh-yue-hant | +/- |
[edit] Source code
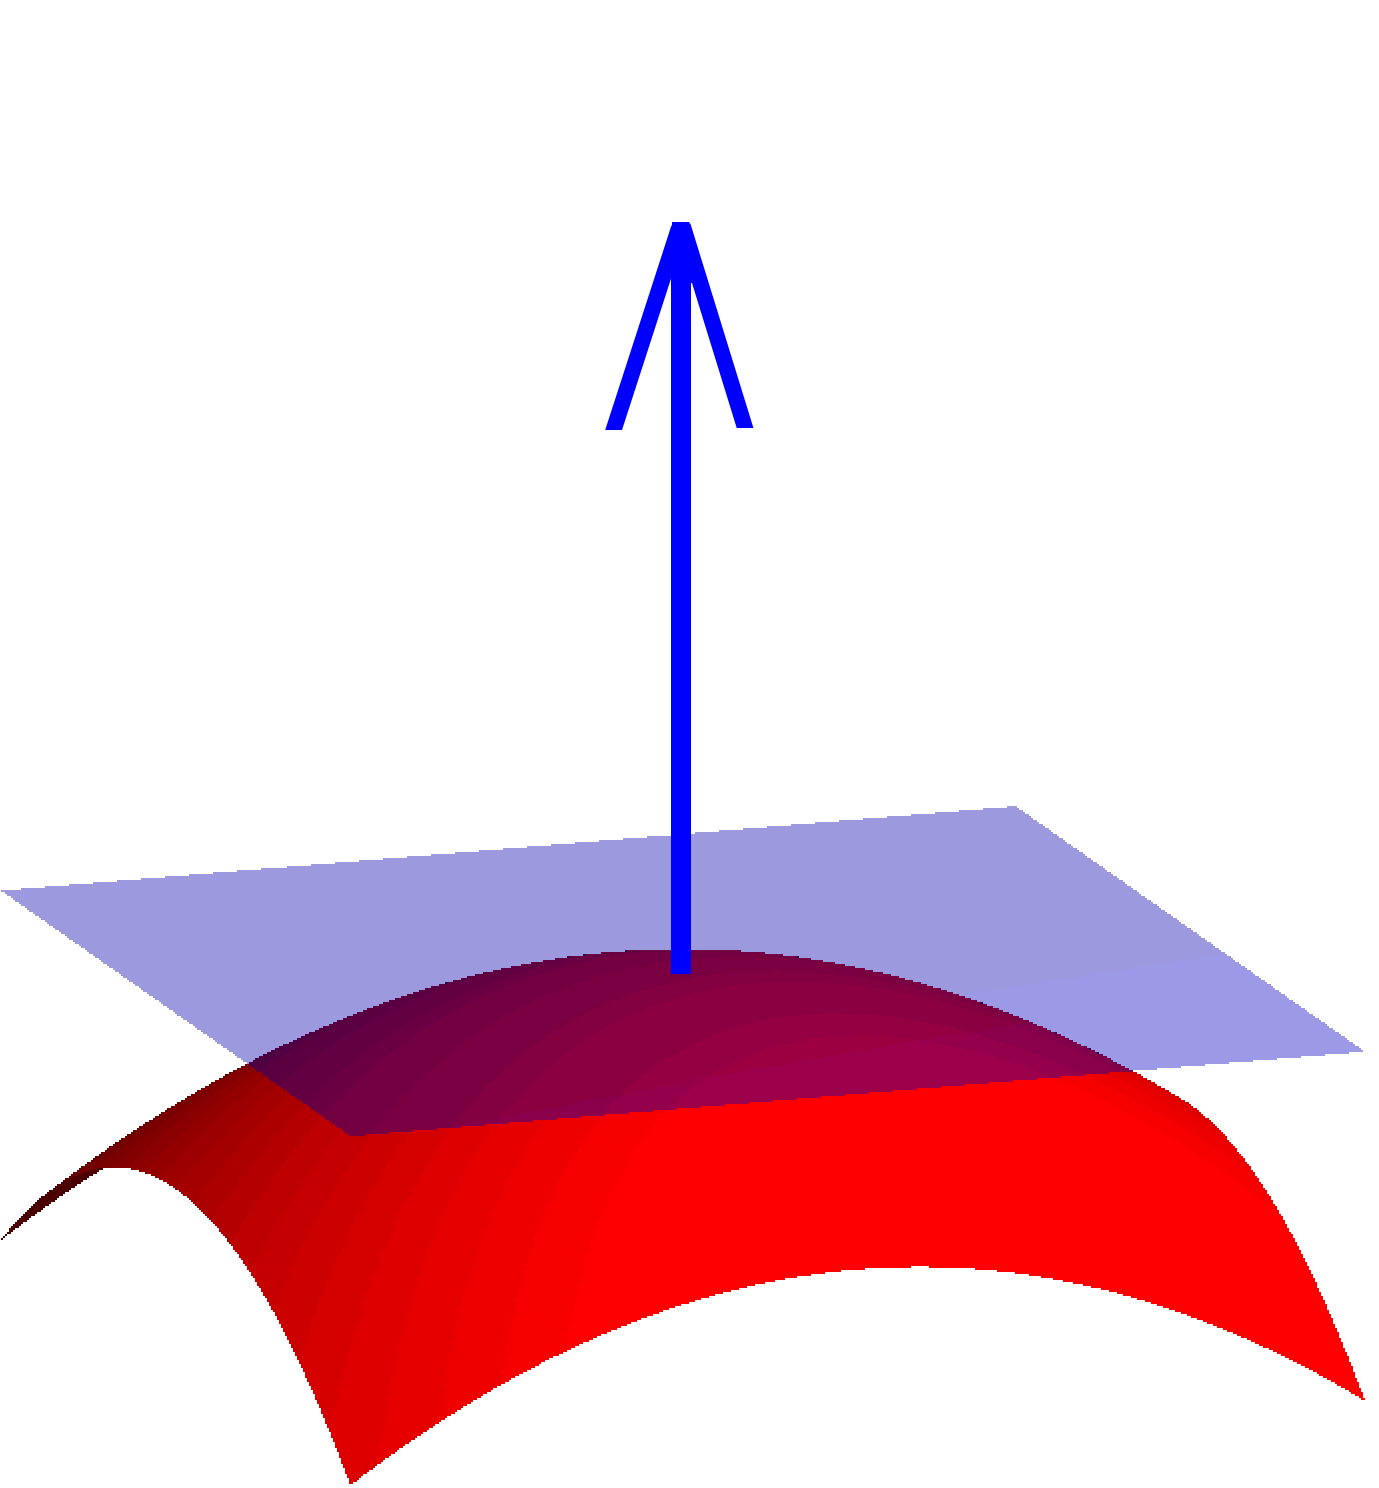
% an illustration of the surface normal

function main ()

% a few settings
   BoxSize=5;
   N=100;
   gridsize=BoxSize/N;
   lw=5;  % linewidth
   fs=35; % fontsize

% the function giving the surface and its gradient
   f=inline('10-(x.^2+y.^2)/15', 'x', 'y');
   fx=inline('-2*x/15', 'x', 'y');
   fy=inline('-2*y/15', 'x', 'y');

% calc the surface
   XX=-BoxSize:gridsize:BoxSize;
   YY=-BoxSize:gridsize:BoxSize;
   [X, Y]=meshgrid(XX, YY);
   Z=f(X, Y);

% plot the surface
   H=figure(1); clf; hold on; axis equal; axis off;
   view (-19, 14);
   surf(X, Y, Z, 'FaceColor','red', 'EdgeColor','none', ...
        'AmbientStrength', 0.3, 'SpecularStrength', 1, 'DiffuseStrength', 0.8);
   surf(X, Y, 0*Z+f(0, 0)+0.02, 'FaceColor', [0, 0, 1], 'EdgeColor','none', 'FaceAlpha', 0.4)

   camlight right; lighting phong; % make nice lightning

% the vector at the current point, as well as its tangent and normal components
   Z0=[0, 0, f(0, 0)];
   n=[fx(0, 0), fy(0, 0), 1];
   n=2*n/norm(n);

% graph the vectors
   HH=quiver3(Z0(1), Z0(2), Z0(3), n(1), n(2), n(3), 0.8); set(HH(1), 'linewidth', lw);

   set(HH(2), 'linewidth', lw)
   set(HH(2), 'XData', 0.4*[-0.78408 0 0.78408 NaN])
   set(HH(2), 'YData', 0.4*[0.78408 0 -0.78408 NaN])
   set(HH(2), 'ZData', 1*[14.824 17.2 14.824 NaN])

%  save to file
   print('-dpng',  '-r300', 'surface_normal_illustration.png');

%  This picture was tweaked in Gimp after being saved from MATLAB
%  to make the arrow look better.
File history
Click on a date/time to view the file as it appeared at that time.
| Date/Time | Dimensions | User | Comment | |
|---|---|---|---|---|
| current | 01:31, 22 April 2007 | 1,379×1,488 (24 KB) | Oleg Alexandrov | ({{Information |Description= |Source= |Date= |Author= }} ) |
| 20:40, 21 April 2007 | 1,379×1,488 (30 KB) | Oleg Alexandrov | ({{Information |Description= |Source=self-made |Date= |Author= User:Oleg Alexandrov }} ) | |
| 20:30, 21 April 2007 | 1,379×1,488 (30 KB) | Oleg Alexandrov | ({{Information |Description= |Source=self-made |Date= |Author= User:Oleg Alexandrov }} ) | |
| 20:09, 21 April 2007 | 1,379×1,488 (18 KB) | Oleg Alexandrov | ({{Information |Description= |Source=self-made |Date= |Author= User:Oleg Alexandrov }} ) | |
| 20:00, 21 April 2007 | 1,398×1,305 (24 KB) | Oleg Alexandrov | ({{Information |Description= |Source=self-made |Date= |Author= User:Oleg Alexandrov }} ) | |
| 19:57, 21 April 2007 | 1,395×1,377 (24 KB) | Oleg Alexandrov | ({{Information |Description= |Source=self-made |Date= |Author= User:Oleg Alexandrov }} ) | |
| 19:55, 21 April 2007 | 2,400×1,800 (34 KB) | Oleg Alexandrov | ({{Information |Description= |Source=self-made |Date= |Author= User:Oleg Alexandrov }} ) |

