Image:Norway hubbert.jpg
From Wikipedia, the free encyclopedia
Size of this preview: 800 × 600 pixels
Full resolution (1,201 × 900 pixels, file size: 81 KB, MIME type: image/jpeg)
| | This is a file from the Wikimedia Commons. The description on its description page there is shown below.
|
| This image was uploaded in the JPEG format even though it consists of non-photographic data. The information it contains could be stored more efficiently or more accurately in the PNG format or SVG format. If possible, please upload a PNG or SVG version of this image, derived from a non-JPEG source so that it doesn't contain any compression artifacts (or with existing artifacts removed) and with transparency where appropriate. After doing so, please replace all instances of the JPEG version throughout Wikipedia (noted under the "File links" header), tag the JPEG version with {{obsolete|NewImage.ext}}, and remove this tag. For more information, see Wikipedia:Preparing images for upload. |
 It is recommended that the other file be used. Alemannisch | العربية | Български | Česky | Dansk | Deutsch | English | Ελληνικά | Esperanto | Español | Français | Galego | עברית | हिन्दी | Magyar | Bahasa Indonesia | Italiano | 日本語 | 한국어 | Lietuvių | Nederlands | Norsk (nynorsk) | Polski | Português | Română | Русский | Slovenščina | Српски / Srpski | Svenska | Türkçe | 中文(简体) | 中文(繁體) | +/- |
[edit] Description
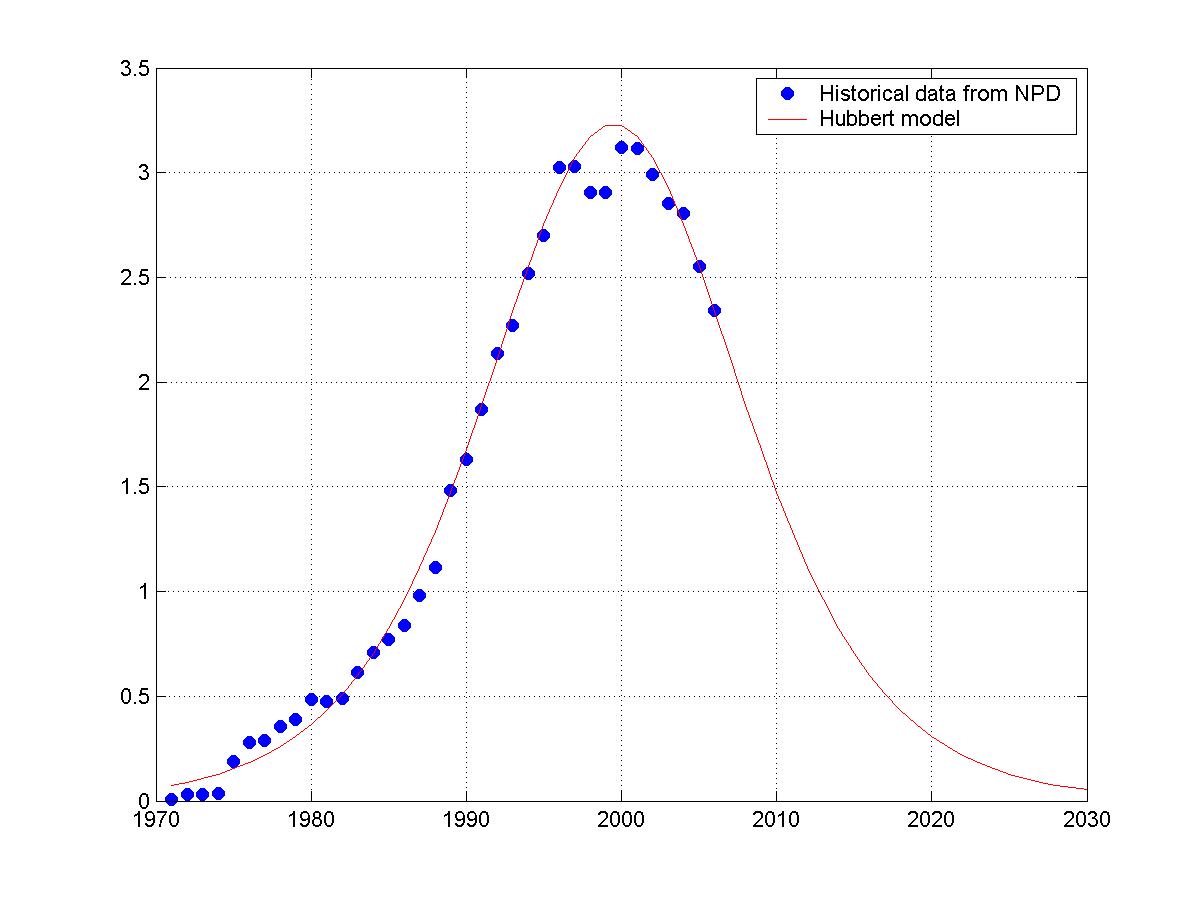
Production de pétrole de la Norvège : chiffres historiques (carrés bruns) comparés avec la modélisation par une courbe de Hubbert prévoyant une production totale de 32 milliards de barrils avec un pic en l'an 2000 et un paramètre 1/b = 6,5 (exprimant le taux de croissance initial et de déclin final).
La Norvège a connu une exploration pétrolière rapide et sans relâche, les gisements ont été mis en production au fur et à mesure de leur découverte et aucun évèement grave n'a causé d'interruption.
Ces trois facteurs expliquent la qualité excellente de la superposition entre modèle et données historiques. Selon le modèle, il reste 11 milliards de barrils à produire. Les réserves annoncées par la Norvège, qui a une qualité d'information unique au monde, sont de 10 milliards de barrils.
L'effondrement futur de la production parait inéluctable, sauf si une nouvelle province (donc non incluse dans cette courbe) est trouvée.
Oil Production of Norway: historical figures (brown squares) compared with a Hubbert curve calculated with a total production of 32 billion barrels, peak in the year 2000 and 1/b parameter = 6.5 (his parameter describe initial growth / final decline rate).
Norway knew a fast, intensive oil exploration, fields were produced as fast as possible after their discovery and nothing came to disrupt production.
These three factors explain the good superposition between historical data and model. According to the model, 11 billion barrels are still to be produced. The reserves announced by Norway, which has a single quality of information in the world, are 10 billion barrels.
The future collapse of the production appears inescapable, except if a new province (thus not included in this curve) is found.
[edit] Licence
|
Utilisateur/User (fr): [1]
Logiciel Utilisé/software used : OpenOffice 2.0
Données historiques de production de BP statistical review of world Energy 2006
Historical data from "BP statistical review of world Energy 2006"
File history
Click on a date/time to view the file as it appeared at that time.
| Date/Time | Dimensions | User | Comment | |
|---|---|---|---|---|
| current | 16:19, 22 January 2007 | 1,201×900 (81 KB) | Raminagrobis | (newx version, with 2006 production. Made under matlab. ) |
| 15:02, 6 September 2006 | 601×431 (40 KB) | Pixel ;-) | (== Description == Production de pétrole de la Norvège : chiffres historiques (carrés bruns) comparés avec la modélisation par une courbe de Hubbert prévoyant une production totale de 32 milliards de barrils avec un pic en l'an 2000 et un para) |

