Image:Newhavenecon.JPG
From Wikipedia, the free encyclopedia
Size of this preview: 800 × 570 pixels
Full resolution (1,037 × 739 pixels, file size: 72 KB, MIME type: image/jpeg)
[edit] Summary
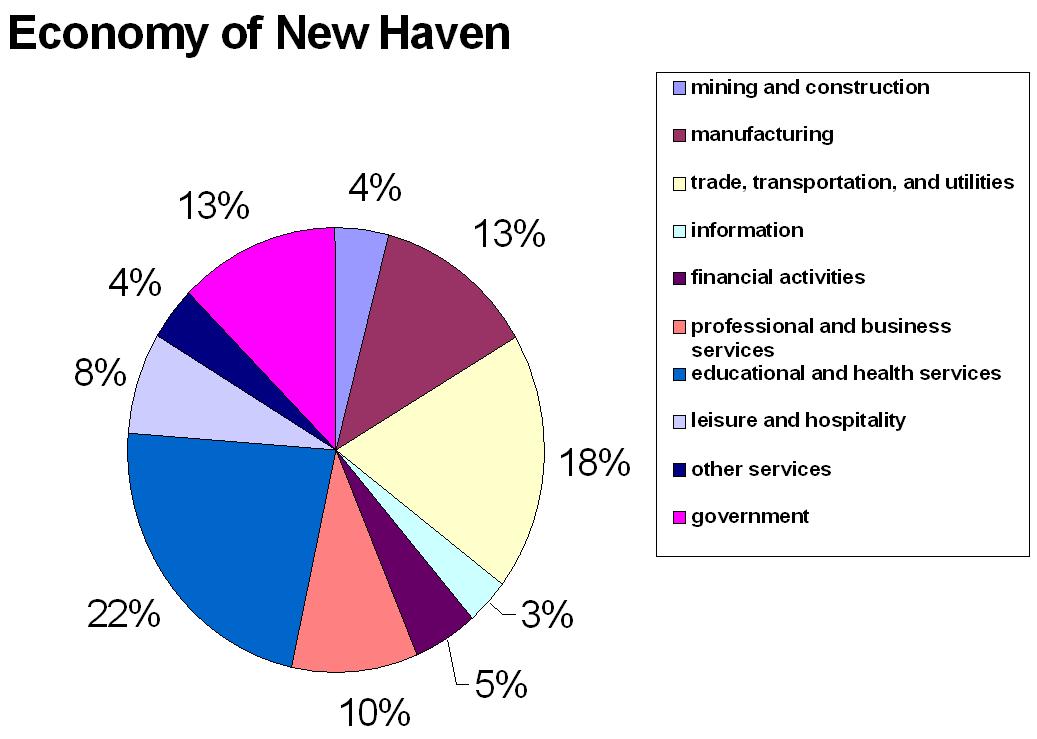
A pie chart made in Excel demonstrating the distribution of the economy of New Haven, Connecticut. Data taken from [1], using the following data:
mining and construction: 11,500
manufacturing: 34,000
trade, transportation, and utilities: 50,300
information: 8,700
financial activities: 14,100
professional and business services: 25,900
educational and health services: 61,700
leisure and hospitality: 20,500
other services: 10,500
government: 34,200
[edit] Licensing
 |
I, the copyright holder of this work, hereby grant the permission to copy, distribute and/or modify this document under the terms of the GNU Free Documentation License, Version 1.2 or any later version published by the Free Software Foundation; with no Invariant Sections, no Front-Cover Texts, and no Back-Cover Texts. |
File history
Click on a date/time to view the file as it appeared at that time.
| Date/Time | Dimensions | User | Comment | |
|---|---|---|---|---|
| current | 01:51, 4 July 2007 | 1,037×739 (72 KB) | Loodog (Talk | contribs) | (== Summary == A pie chart made in Excel demonstrating the distribution of the economy of New Haven, Connecticut. Data taken from [http://www.city-data.com/us-cities/The-Northeast/New-Haven-Economy.html], using the following data: mining and construc) |
- Search for duplicate files
- Edit this file using an external application
See the setup instructions for more information.
File links
The following pages on the English Wikipedia link to this file (pages on other projects are not listed):

