Image:Linearspline.png
From Wikipedia, the free encyclopedia
No higher resolution available.
Linearspline.png (282 × 156 pixels, file size: 2 KB, MIME type: image/png)
| | This is a file from the Wikimedia Commons. The description on its description page there is shown below.
|
[edit] Summary
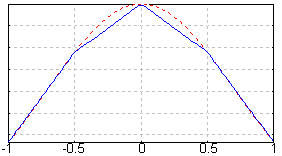
| Description |
An image of a en:linear spline and the function it is approximating. It was created using en:gnuplot with the command: plot [-1:1] [0.367:1] exp(-x**2); replot -1 <= x && x <= -0.5 ? exp(-1) + 2*(exp(-1.0/4)-exp(-1))*(x+1) : -0.5 <= x && x <= 0 ? exp(-1.0/4) + 2*(1-exp(-1.0/4))*(x+1.0/2) : 0 <= x && x <= 0.5 ? 1 + 2*(exp(-1.0/4)-1)*x : exp(-1.0/4) + 2*(exp(-1) - exp(-1.0/4))*(x-1.0/2) |
|---|---|
| Source |
jaredwf 17:03, 10 May 2004 (UTC) |
| Date | |
| Author |
User Jaredwf on en.wikipedia |
| Permission (Reusing this image) |
This image is in the public domain. |
| Other versions |
Originally from en.wikipedia; description page is (was) here * 10:03, 15 May 2004 [[:en:User:Jaredwf|Jaredwf]] 282×156 (1,986 bytes) <span class="comment">(smaller version)</span> * 16:16, 10 May 2004 [[:en:User:Jaredwf|Jaredwf]] 432×206 (3,152 bytes) <span class="comment">(A linear spline image that I created using gnuplot. {{msg:PD}})</span> |
| This image has been (or is hereby) released into the public domain by its author, Jaredwf at the Wikipedia project. This applies worldwide. In case this is not legally possible: |
(Uploaded using CommonsHelper or PushForCommons)
[edit] Licensing
 |
The copyright holder of this work allows anyone to use it for any purpose including unrestricted redistribution, commercial use, and modification.
Note: العربية | Asturianu | Български | Česky | Dansk | Deutsch | English | Esperanto | Español | فارسی | Français | Galego | Italiano | 日本語 | 한국어 | Kurdî / كوردی | Nederlands | Polski | Português | Русский | Suomi | Svenska | Türkçe | Shqip | 中文(简体) | 中文(繁體) | 粵語 | +/- |
 |
This graph image should be recreated using vector graphics as an SVG file. This has several advantages; see Commons:Media for cleanup for more information. If an SVG form of this image is already available, please upload it. After uploading an SVG, replace this template with template {{Vector version available|new image name.svg}} in this image. |
|
العربية | Български | Català | Česky | Dansk | Deutsch | English | Esperanto | Español | Français | 한국어 | Italiano | Magyar | Lietuvių | Nederlands | 日本語 | Polski | Português | Română | Русский | Suomi | Svenska | Türkçe | Українська | Tiếng Việt | मराठी | 中文(繁體) | 中文(简体) | +/- |
|
File history
Click on a date/time to view the file as it appeared at that time.
| Date/Time | Dimensions | User | Comment | |
|---|---|---|---|---|
| current | 05:16, 24 October 2006 | 282×156 (2 KB) | Sterrys | ({{Information| |Description= An image of a en:linear spline and the function it is approximating. It was created using en:gnuplot with the command: plot [-1:1] [0.367:1] exp(-x**2); replot -1 <= x && x <= -0.5 ? exp(-1) + 2*(exp(-1.0/4)-exp(-1)) |

