Image:Laplace distribution pdf.png
From Wikipedia, the free encyclopedia
Size of this preview: 800 × 600 pixels
Full resolution (1,300 × 975 pixels, file size: 135 KB, MIME type: image/png)
| | This is a file from the Wikimedia Commons. The description on its description page there is shown below.
|
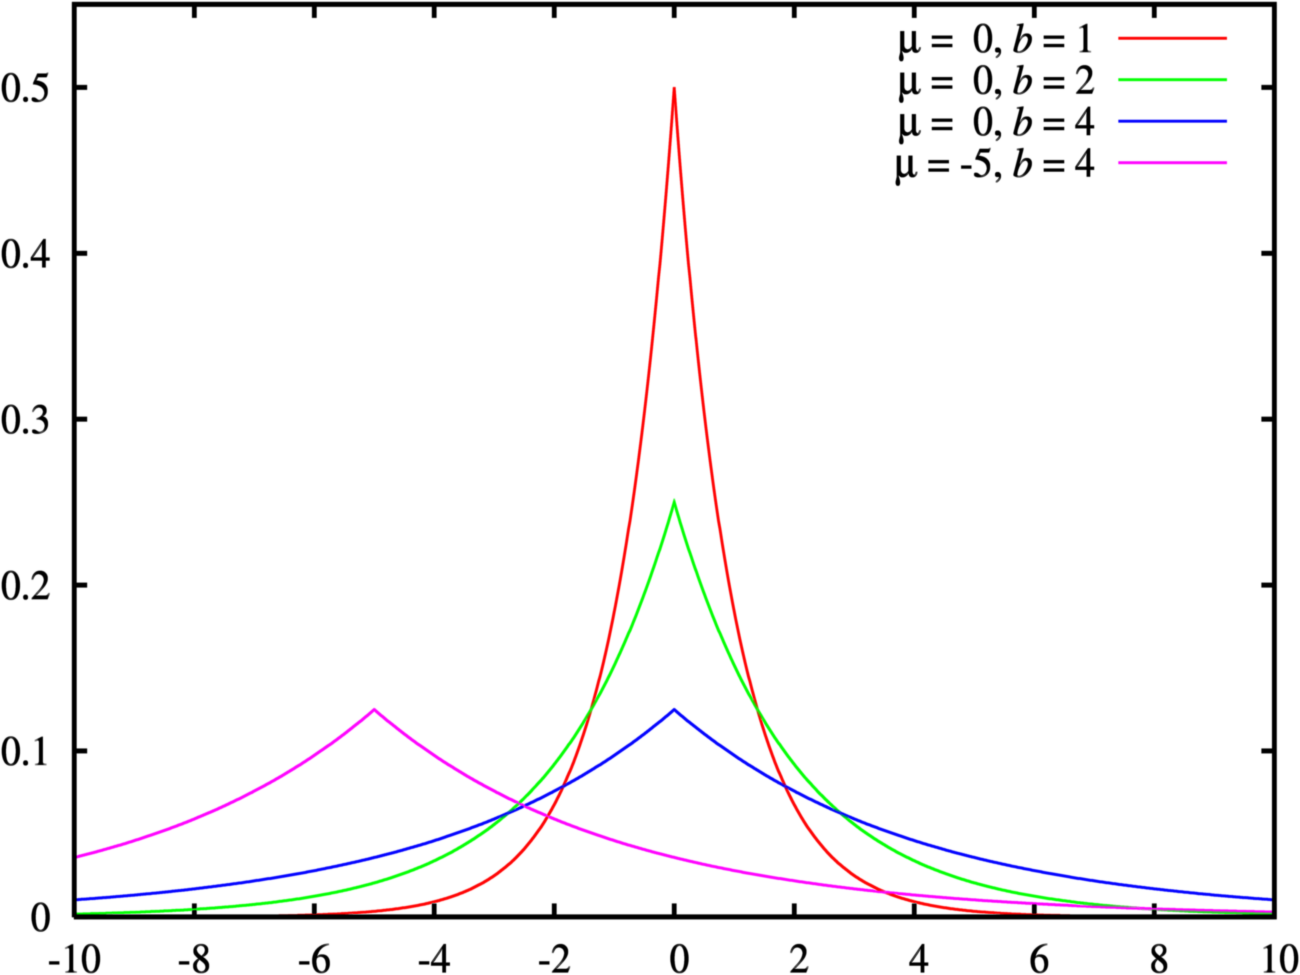
Probability density function for the Laplace distribution
gnuplot source under GPL:
dlaplace(x,mu,b) = 0.5/b * exp(-abs(x-mu)*1.0/b)
plaplace(x,mu,b) = 0.5*(1 + sgn(x-mu)*(1-exp(-abs(x-mu)*1.0/b)))
qlaplace(p,mu,b) = mu - b * sgn(p-0.5) * log(1 - 2*abs(p-0.5))

set samples 1001
set terminal postscript enhanced color solid lw 2 "Times-Roman" 20
set output

set xtics -10,2
set ytics 0,0.1

f(x,y,z) = dlaplace(x,y,z)
set yrange [0:0.55]

#f(x,y,z) = plaplace(x,y,z)
#set key bottom

plot [-10:10] \
   f(x, 0,1) title "{/Symbol m} =  0, {/Times-Italic b} = 1", \
   f(x, 0,2) title "{/Symbol m} =  0, {/Times-Italic b} = 2", \
   f(x, 0,4) title "{/Symbol m} =  0, {/Times-Italic b} = 4", \
   f(x,-5,4) title "{/Symbol m} = -5, {/Times-Italic b} = 4"
 |
This work is free software; you can redistribute it and/or modify it under the terms of the GNU General Public License as published by the Free Software Foundation; either version 2 of the License, or any later version. This work is distributed in the hope that it will be useful, but WITHOUT ANY WARRANTY; without even the implied warranty of MERCHANTABILITY or FITNESS FOR A PARTICULAR PURPOSE. See version 2 and version 3 of the GNU General Public License for more details.
العربية | Català | Česky | Deutsch | Ελληνικά | English | Español | فارسی | Français | Italiano | 日本語 | Nederlands | Polski | Português | Русский | Slovenčina | Svenska | Türkçe | 中文(简体) | 中文(繁體) | +/- |
File history
Click on a date/time to view the file as it appeared at that time.
| Date/Time | Dimensions | User | Comment | |
|---|---|---|---|---|
| current | 08:19, 13 March 2005 | 1,300×975 (135 KB) | MarkSweep | (Probability density function for the Laplace distribution {{GFDL}}) |
File links
The following pages on the English Wikipedia link to this file (pages on other projects are not listed):

