Image:Freezing point depression and boiling point elevation.png
From Wikipedia, the free encyclopedia
No higher resolution available.
Freezing_point_depression_and_boiling_point_elevation.png (728 × 452 pixels, file size: 10 KB, MIME type: image/png)
| | This is a file from the Wikimedia Commons. The description on its description page there is shown below.
|
[edit] Summary
| Description |
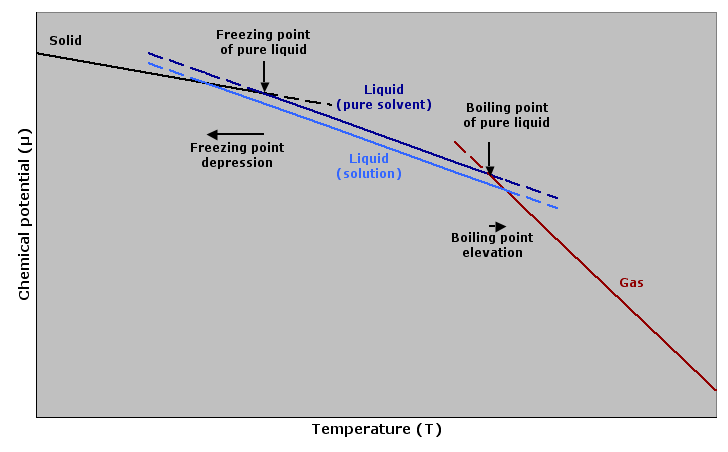
Principle graph of chemical potential against temperature explaining freezing point depression and boiling point elevation |
|---|---|
| Source |
self-made |
| Date |
October 20, 2007 |
| Author | |
| Permission (Reusing this image) |
see below |
[edit] Licensing

File history
Click on a date/time to view the file as it appeared at that time.
| Date/Time | Dimensions | User | Comment | |
|---|---|---|---|---|
| current | 18:28, 20 October 2007 | 728×452 (10 KB) | Tomas er | (== Summary == {{Information |Description=Principle graph of chemical potential against temperature explaining freezing point depression and boiling point elevation |Source=self-made |Date=October 20, 2007 |Author= Tomas er }} [[Category) |
| 18:25, 20 October 2007 | 728×452 (10 KB) | Tomas er | (== Summary == {{Information |Description=Principle graph of chemical potential against temperature explaining freezing point depression and boiling point elevation |Source=self-made |Date=October 20, 2007 |Author= Tomas er }} [[Category) | |
| 18:19, 20 October 2007 | 728×452 (10 KB) | Tomas er | ({{Information |Description=Principle graph of chemical potential against temperature explaining freezing point depression and boiling point elevation |Source=self-made |Date=October 20, 2007 |Author= Tomas er }} ) |
File links
The following pages on the English Wikipedia link to this file (pages on other projects are not listed):

