Image:Floyd flood map.jpg
From Wikipedia, the free encyclopedia
No higher resolution available.
Floyd_flood_map.jpg (350 × 269 pixels, file size: 35 KB, MIME type: image/jpeg)
| | This is a file from the Wikimedia Commons. The description on its description page there is shown below.
|
[edit] Summary
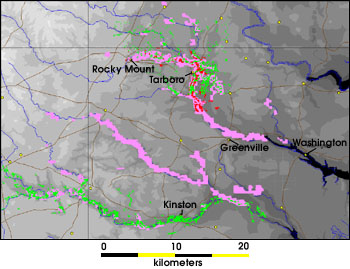
This flood map shows a comparison of the flood data collected by AVHRR (pink pixels), Radarsat (red pixels), and Landsat 7 (green pixels). These colors show areas that were flooded in the wake of Hurricane Floyd. Due to interference from clouds and forest canopies, geographers often get the best insight into a flood when they use data from multiple satellite sensors. (Image courtesy Dartmouth Flood Observatory, E. Anderson and R.H. Brakenridge)
| Color | Date | Source |
|---|---|---|
| September 17 | AVHRR | |
| September 23 | Radarsat | |
| September 30 | Landsat 7 |
[edit] Source
http://earthobservatory.nasa.gov/Study/FloydSediment/sediment_2.html - a larger image is available; the smaller image is preferred here because the text is larger
[edit] Licensing
|
|
This file is in the public domain because it was created by NASA. NASA copyright policy states that "NASA material is not protected by copyright unless noted". (NASA copyright policy page or JPL Image Use Policy).
Deutsch | English | Español | Français | Nederlands | Português | Русский | 中文(简体) | 中文(繁體) | +/- |
|
 |
Warnings:
|
File history
Click on a date/time to view the file as it appeared at that time.
| Date/Time | Dimensions | User | Comment | |
|---|---|---|---|---|
| current | 08:01, 31 January 2006 | 350×269 (35 KB) | Jdorje | (his flood map shows a comparison of the flood data collected by AVHRR (pink pixels), Radarsat (red pixels), and Landsat 7 (green pixels). These colors show areas that were flooded in the wake of Hurricane Floyd. Due to interference from clouds and forest ) |

