Image:Fin population by age 2005.png
From Wikipedia, the free encyclopedia
No higher resolution available.
Fin_population_by_age_2005.png (480 × 576 pixels, file size: 5 KB, MIME type: image/png)
| | This is a file from the Wikimedia Commons. The description on its description page there is shown below.
|
Contents |
[edit] Yhteenveto
[edit] Summary
| Description |
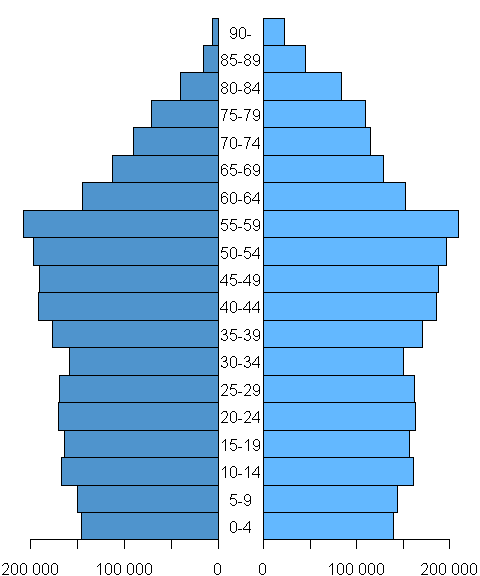
English: Finnish population by age and gender, end of 2005 (Men: left, dark blue / Women: right, light blue)
Suomi: Suomen väestö iän ja sukupuolen mukaan vuoden 2005 lopussa (Miehet: vasen, tumman sininen / Naiset: oikea, vaalean sininen)
|
|---|---|
| Source |
Data from Statistics Finland (Population by age group, end of 2005), graph own work |
| Date |
2007-03-05 |
| Author | |
| Permission (Reusing this image) |
PD-Own |
[edit] R source
 # R source (www.r-project.org)
 m <- c(145596,149894,167327,164118,170710,169408,158395,176975,191803,191198,196815,
        207826,145517,113204,90986,70909,40013,15887,5769)
 w <- c(139353,143522,161212,156824,163226,161766,150595,170779,185979,187897,196158,
        209062,152460,129230,114778,109611,83845,44605,22328)
 a <- c("0-4","5-9","10-14","15-19","20-24","25-29","30-34","35-39","40-44","45-49",
        "50-54","55-59","60-64","65-69","70-74","75-79","80-84","85-89","90-")
 png("fin_population_by_age.png", width = 480, height = 480*1.2)
 par(mfcol=c(1,2),mar=c(2,1.2,1,1.2))
 y <- barplot(-m,space=0,horiz=T,xlim=c(-210000,0),axes=F,yaxs="i",col="steelblue3")
 axis(1,at=-4:0*50000,labels=c("200 000","","100 000","","0"))
 barplot(w,space=0,horiz=T,axes=F,yaxs="i",col="steelblue1")
 axis(1,at=0:4*50000,labels=c("0","","100 000","","200 000"))
 axis(2,at=y,labels=a,tick=F,las=1,line=.1,hadj=.5)
 dev.off()
[edit] Licensing
| I, the copyright holder of this work, hereby release it into the public domain. This applies worldwide. In case this is not legally possible: Afrikaans | Alemannisch | Aragonés | العربية | Asturianu | Български | Català | Česky | Cymraeg | Dansk | Deutsch | Eʋegbe | Ελληνικά | English | Español | Esperanto | Euskara | Estremeñu | فارسی | Français | Galego | 한국어 | हिन्दी | Hrvatski | Ido | Bahasa Indonesia | Íslenska | Italiano | עברית | Kurdî / كوردی | Latina | Lietuvių | Latviešu | Magyar | Македонски | Bahasa Melayu | Nederlands | Norsk (bokmål) | Norsk (nynorsk) | 日本語 | Polski | Português | Ripoarisch | Română | Русский | Shqip | Slovenčina | Slovenščina | Српски / Srpski | Svenska | ไทย | Tagalog | Türkçe | Українська | Tiếng Việt | Walon | 中文(简体) | 中文(繁體) | zh-yue-hant | +/- |
File history
Click on a date/time to view the file as it appeared at that time.
| Date/Time | Dimensions | User | Comment | |
|---|---|---|---|---|
| current | 20:43, 5 March 2007 | 480×576 (5 KB) | Jkv | (== Summary == {{Information |Description= {{en|Finnish population by age and gender (Men = left & dark blue; Women = right & light blue)}} {{fi|Suomen väestö iän ja sukupuolen mukaan (Miehet vasen & tumman sininen; Naiset = oikea & vaalean sininen)}} ) |

