Talk:Dvorak technique
From Wikipedia, the free encyclopedia
[edit] Todo
More info. Perhaps you could mention storms where Dvorak constraints were broken. That occurred during Elida during the 2002 EPAC season. Also, what are the highest ones? IIRC, Angela in 1995 got up to an 8, along with 2 other storms. Hurricanehink (talk) 03:42, 22 May 2006 (UTC)
- I think the Dvorak constraints are not very useful. They simply, (if my understanding is correct) give a guideline of how fast a typical storm will stregthen. Is based on statistical data, does not consider the environment of the hurricane. Also 8.0 is the highest possible Dvorak number. TimL 03:18, 26 May 2006 (UTC)
- Cyclone Monica got an estimate of 8 this year, though unofficially (from the JTWC). —CuiviénenT|C, Wednesday, 24 May 2006 @ 00:22 UTC
Part of the text seems to be cut off at the end. Also, I've seen a chart somewhere with a column for the minimum pressure estimates for pacific basin storms as they have a lower pressure in general. I can't remember if it was on the NHC site or in Dvorak's paper itself. I have it saved somewhere on my computer if you decide to add it and can't locate the numbers. Dr Denim 03:46, 22 May 2006 (UTC)
- oh and I just remembered something else worth adding is the usage of the Dvorak technique in forecasting intensity changes Dr Denim 03:57, 22 May 2006 (UTC)
- How is the technique used for forecasting intensity changes? TimL 19:25, 23 May 2006 (UTC)
- Further research indicates to me that the Dvorak technique is not skilled at forecasting intensity. It is not mentioned by the NHC in their year-end accuracy report, so I don't think it is worth a mention here. TimL 03:18, 26 May 2006 (UTC)
- I think it might still be worth mentioning as it is part of the technique even if it isn't used often and I'd assume it is just as reliable as the persistance model for intensity change...can't remember what that was called...Dr Denim 12:25, 26 May 2006 (UTC)
- The important thing to remember about the Dvorak technique is that it isn't used as a model to numerically predict intensities, but rather just a "the intensity is increasing/decreasing/steady state" kind of thing, which can just as easily be determined by simply looking at a satellite image. It's more of a predictor of what trend is currently underway in the cyclone's structure/intensity. And since its forecasting role is so limited, and it is not a model of any sort, it isn't mentioned in the NHC's verification reports. WindRunner 18:56, 27 May 2006 (UTC)
- I think it might still be worth mentioning as it is part of the technique even if it isn't used often and I'd assume it is just as reliable as the persistance model for intensity change...can't remember what that was called...Dr Denim 12:25, 26 May 2006 (UTC)
- Further research indicates to me that the Dvorak technique is not skilled at forecasting intensity. It is not mentioned by the NHC in their year-end accuracy report, so I don't think it is worth a mention here. TimL 03:18, 26 May 2006 (UTC)
- How is the technique used for forecasting intensity changes? TimL 19:25, 23 May 2006 (UTC)
- okay...I see...i missread the last line Dr Denim 04:01, 22 May 2006 (UTC)
I remember Elida, she was crazy. Discussion of breaking Dvorak: [1] [2] [3]:
ELIDA HAS BROKEN ALL THE DVORAK RULES. IT HAS INTENSIFIED RAPIDLY
SINCE YESTERDAY AND DATA T-NUMBERS ARE UP TO 6.0 PLUS WITH OBJECTIVE
NUMBERS REACHING 6.5 DURING THE PAST HOUR OR SO.
-- RattleMan 03:50, 22 May 2006 (UTC)
Something else that might be handy is an example satelite image...and for that matter if we could somehow upload the drawings(or replications of them) of the satelite images for different CI numbers that apear in his essay on the technique that'd be really helpful...if I could find a way to make the images on my computer or get my scanned drawings to look smoother I'd be willing to make them...I have them sketched somewhere...anywhoDr Denim 11:43, 23 May 2006 (UTC)
- also...is the essay online somewhere?Dr Denim 11:43, 23 May 2006 (UTC)
- Yes, I thought that might be a compelling addition to the article. I have not seen the essay, nor do I know how to access it, but an idea I had was to grab public domain satellite image for storms of a certain CI and show them together. There could be a set of images for several 3.0 CI storms and another set for several 4.0 CI storms. TimL 19:25, 23 May 2006 (UTC)
-
- Sample satellite images, done. Room for improvement here though. TimL 03:18, 26 May 2006 (UTC)
- well...if you live near a university that has a meteorology program then they might have one...if I get the chance to stop by school sometime this summer I'll have to try and photocopy the essay so I can have a copy of it on hand...I've looked around the noaa websites for it but haven't had any luck...mayhap I'll look around on google or something...anywho...those reference images would be really helpful in explaining the technique...especially to someone who isn't familiar with the terminology. I'll look around and see if I can't find a copy of the essay online somewhereDr Denim 20:06, 23 May 2006 (UTC)
- here's a link to the abstract so that the citation information can be added by someone at least...still looking for an online version though
- Abstract
-
Dr Denim 20:09, 23 May 2006 (UTC)
-
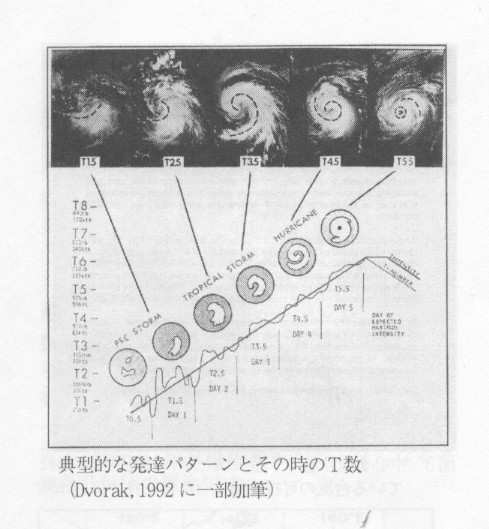
- ah here's an image of one of the several charts in the paper...the website's messed up on this computer(probably in an asian charater set) so I can't tell if it's public domain or not (although considering the fact that I can't find the essay itself it's probably not public domain)...anywho
- and here's another website on the objective version used now
Okay...so I uploaded the notes I took when I read the essay onto my deviant art account...although I never got around to finishing the essay but I got a good chunk of it done...
- I think we might want the diagrams from Bureau of Meteorology's Global Guide to Forecasting from the Tropical Cyclone Intensity subsection (click each Figure link). --AySz88^-^ 03:42, 26 May 2006 (UTC)
Could we have a wider range of images showing TCs at various CI's. 2.5, 3.0 and 3.5 isn't much of a range. It should give an impression of how it varies from 2.0 up to 8.0. And ideally it shouldn't be solely Atlantic storms.--Nilfanion (talk) 09:25, 12 June 2006 (UTC)
- That is quite reasonable. Other basins are doable as long as they have readily available advisory/discussion archives which mention T-numbers. Since the other basins rely soley on the Dvorak technique(i.e no reconaissance) I would be suprised if they didn't.
Images could also be broken down into the various pattern types, though this would require some skill with the dvorak technique. There is a presenation I should throw in the external links which has drawings of the various pattern types at different intensities. TimL 22:52, 12 June 2006 (UTC)
Corrected the spelling of Jack's last name on the External Links section. Margie 00:45, 12 July 2006 (UTC)
[edit] DYK
Before time expires, you may want to send it to Did you know... Titoxd(?!? - help us) 03:47, 26 May 2006 (UTC)
- Thanks, done. TimL 04:08, 26 May 2006 (UTC)
[edit] TODO II
- Accuracy Section
- History Section
- Some sort of figurative examples of pattern types from sattelite imagery.
- Add info from Dvorak's paper (which thanks to Nilfanion (talk · contribs) I realize I could have downloaded all along).
TimL 05:16, 18 June 2006 (UTC)

