Image:CSA states evolution.gif
From Wikipedia, the free encyclopedia
Size of this preview: 800 × 542 pixels
Full resolution (1,000 × 677 pixels, file size: 254 KB, MIME type: image/gif)
| | This is a file from the Wikimedia Commons. The description on its description page there is shown below.
|
| This is a featured picture, which means that members of the community have identified it as one of the finest images on the English Wikipedia, adding significantly to its accompanying article. If you have a different image of similar quality, be sure to upload it using the proper free license tag, add it to a relevant article, and nominate it. |
This is a featured picture on English Wikipedia and is considered one of the finest images.
|
[edit] Summary
| Description |
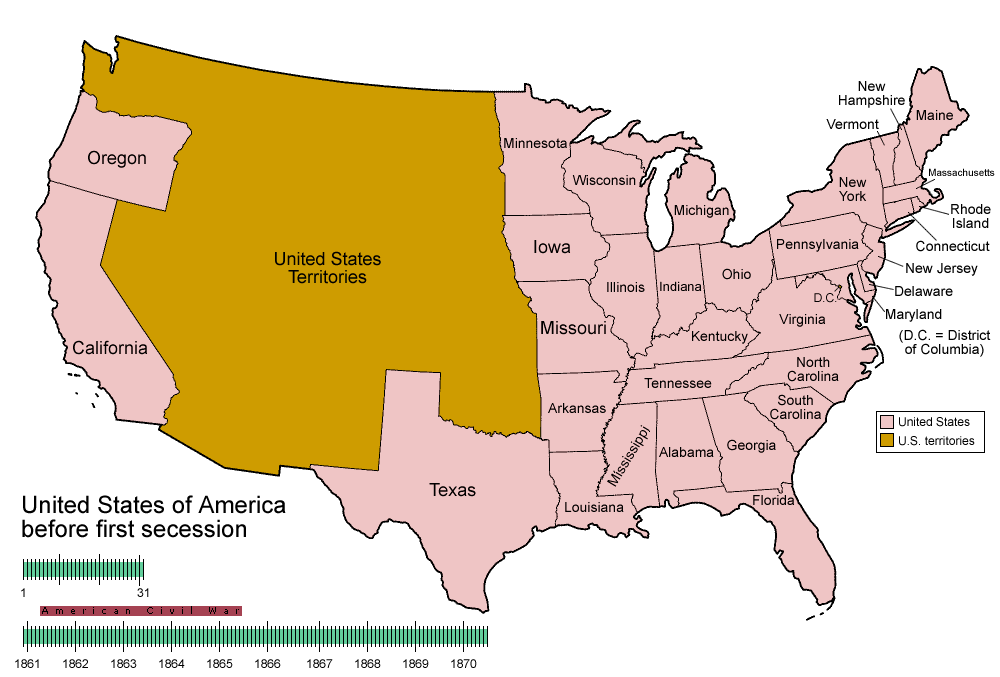
Animated map/timeline of the territorial evolution of the Confederate States of America, from first secession to end of Reconstruction. |
|---|---|
| Source |
Self-made. |
| Date |
March 2007 |
| Author | |
| Permission (Reusing this image) |
see below |
[edit] Licensing

File history
Click on a date/time to view the file as it appeared at that time.
| Date/Time | Dimensions | User | Comment | |
|---|---|---|---|---|
| current | 01:57, 18 November 2007 | 1,000×677 (254 KB) | Golbez | (Removing frame of WV counties; that was incorrect, they were always part of WV) |
| 09:54, 4 March 2007 | 1,000×677 (259 KB) | Golbez | (== Summary == {{Information |Description=Animated map/timeline of the territorial evolution of the Confederate States of America, from first secession to end of Reconstruction. |Source=Self-made. |Date=March 2007 |Author=User:Golbez |Permission= see b) |
File links
The following pages on the English Wikipedia link to this file (pages on other projects are not listed):
- Confederate States of America
- Portal:United States/Selected picture
- User talk:-asx-
- User talk:Golbez/Archive Shichi
- Portal:Atlas/Selected picture
- Wikipedia:Featured pictures thumbs 07
- Wikipedia:Featured picture candidates/March-2007
- Wikipedia:Picture peer review/CSA evolution
- Wikipedia:Featured picture candidates/CSA states evolution
- Wikipedia:Wikipedia Signpost/2007-03-20/Features and admins
- Wikipedia:Wikipedia Signpost/2007-03-20/SPV
- Portal:Atlas/Selected picture/11
- User:Esemono/NorthAmerica
- Wikipedia:Featured pictures/Diagrams, drawings, and maps/Maps
- Portal:United States/Selected picture/15

