Image:CAPspendingbysector.png
From Wikipedia, the free encyclopedia
No higher resolution available.
CAPspendingbysector.png (611 × 382 pixels, file size: 24 KB, MIME type: image/png)
| | This is a file from the Wikimedia Commons. The description on its description page there is shown below.
|
La bildo estas kopiita de wikipedia:en. La originala priskribo estas:
[edit] Summary
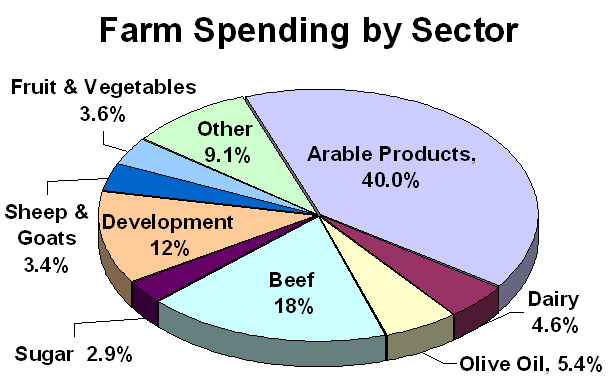
Pie chart showing percentages of CAP expenditure on different agricultural products. Created by me December 2005.
[edit] Licensing
| This image has been (or is hereby) released into the public domain by its author, Sandpiper at the English Wikipedia project. This applies worldwide. In case this is not legally possible: |
| date/time | username | edit summary |
|---|---|---|
| 21:26, 19 December 2005 | en:User:Sandpiper | (Pie chart showing percentages of CAP expenditure on different agricultural products. Created by me December 2005.) |
 |
This graph image should be recreated using vector graphics as an SVG file. This has several advantages; see Commons:Media for cleanup for more information. If an SVG form of this image is already available, please upload it. After uploading an SVG, replace this template with template {{Vector version available|new image name.svg}} in this image. |
|
العربية | Български | Català | Česky | Dansk | Deutsch | English | Esperanto | Español | Français | 한국어 | Italiano | Magyar | Lietuvių | Nederlands | 日本語 | Polski | Português | Română | Русский | Suomi | Svenska | Türkçe | Українська | Tiếng Việt | मराठी | 中文(繁體) | 中文(简体) | +/- |
|
[edit] Historio de la dosiero
Legend: (cur) = this is the current file, (del) = delete this old version, (rev) = revert to this old version.
Click on date to download the file or see the image uploaded on that date.
- (del) (cur) 21:26, 19 December 2005 . . en:User:Sandpiper Sandpiper ( en:User_talk:Sandpiper Talk) . . 611x382 (24190 bytes) (Pie chart showing percentages of CAP expenditure on different agricultural products. Created by me December 2005.)
File history
Click on a date/time to view the file as it appeared at that time.
| Date/Time | Dimensions | User | Comment | |
|---|---|---|---|---|
| current | 07:47, 1 April 2006 | 611×382 (24 KB) | Maksim | (La bildo estas kopiita de wikipedia:en. La originala priskribo estas: == Summary == Pie chart showing percentages of CAP expenditure on different agricultural products. Created by me December 2005. == Licensing == {{PD-self}} {| border="1" ! date/time |) |

